Introduction
Introduction.RmdThe purpose of BetaBase is to provide functions for estimating and visualizing beta distributions, commonly used for Bayesian inference of probabilities. Functions are provided to:
- Determine the bounds of a credible interval containing a specified percent of the probability.
- Calculate the expectation of a beta distribution from its parameters.
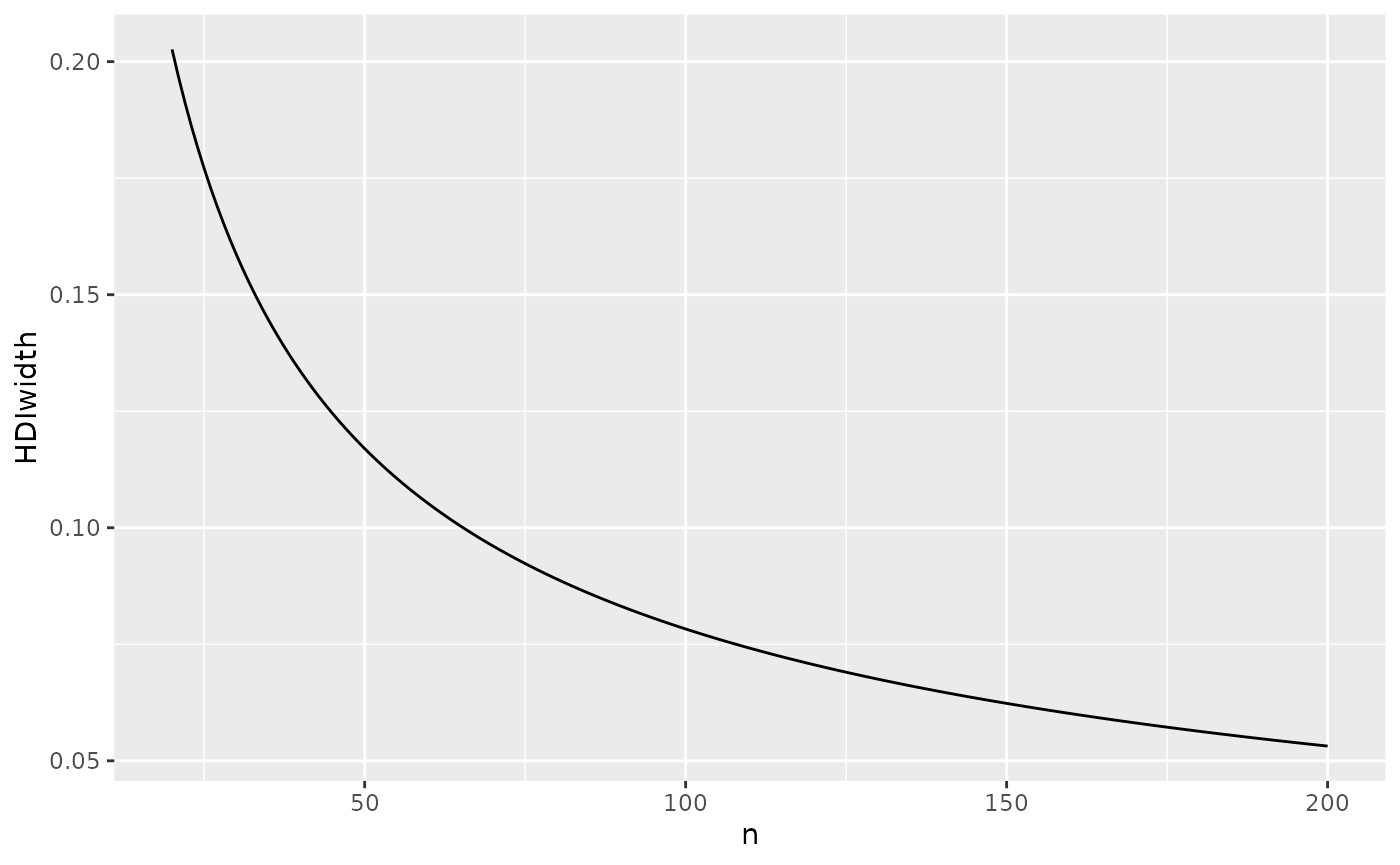
- Determine the expected width of a confidence interval based on sample size.
- Estimate the parameters of a beta distribution from quantiles.
- Plot a beta distribution with optional interval shading and line indicating expected value.
- ggplot2 geoms for interval shading and line indicating expected value.
This introduction is intended to demonstrate the use of a few functions without going into detail about options. For more details see articles/vignettes for specific functions or function documentation.
Plotting a beta Beta(6, 4) distribution.
plotdbeta(6, 4, expectation = TRUE, HDImass = 0.95)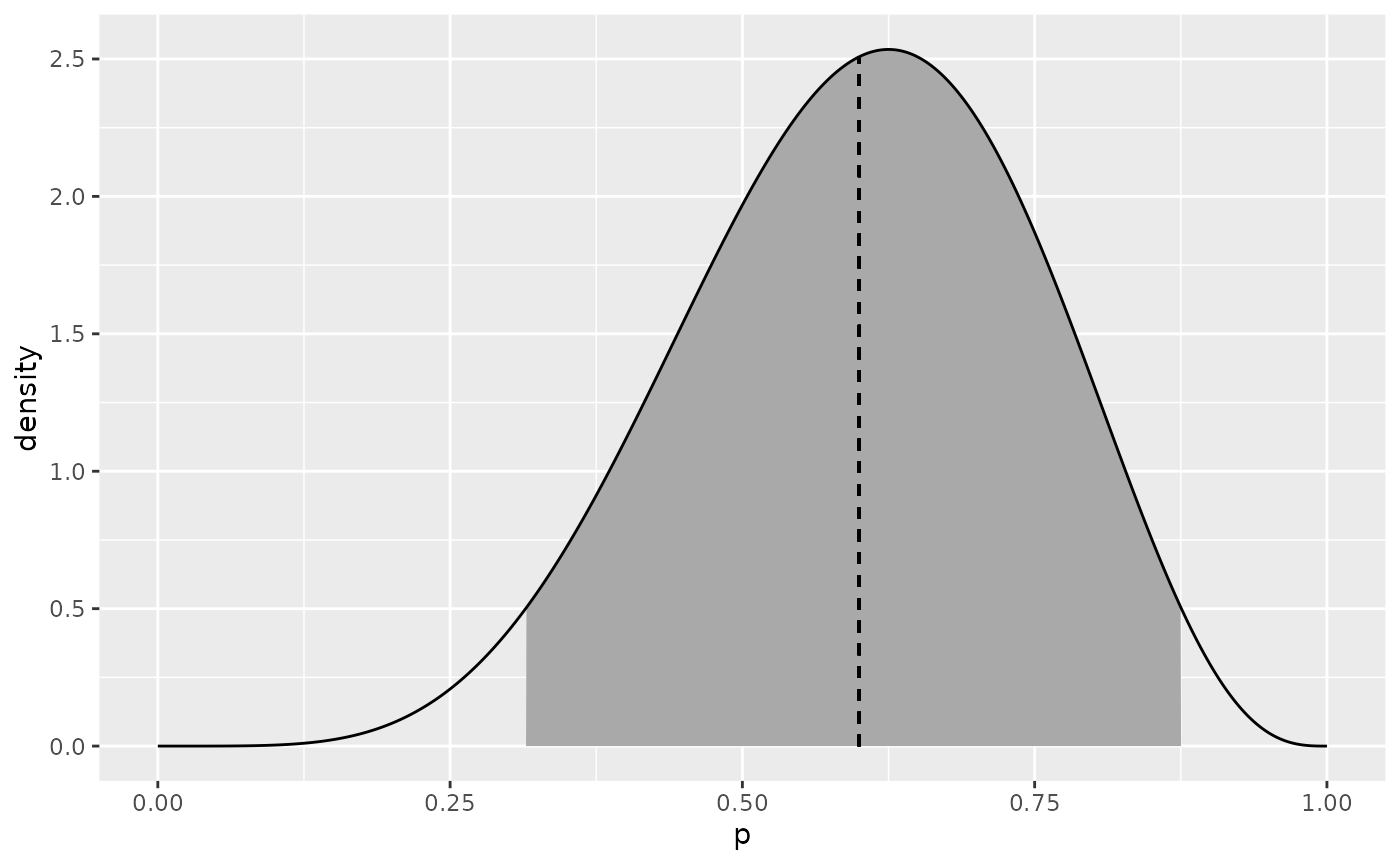
Estimating beta parameters from quantiles.
betaParamsFromQuantiles(q = c(0.1, 0.7))
#> $a
#> [1] 3.078885
#>
#> $b
#> [1] 5.224029
Estimating width of confidence interval from sample size (and other parameters)
df <- betaHDIwidthSim(genPriorMean = 0.1, genPriorN = 2)
ggplot(df, aes(n, HDIwidth)) +
  geom_path()